11 Horrifically Violent Animal Mating Rituals


11 Horrifically Violent Animal Mating Rituals


  Quolls: Death By Fornication

Quolls: Death By Fornication
While you may not have already heard of a quoll, if you know enough about their mating rituals, you won't soon forget the species. Every winter, thefemales all go into heat at the same time, causing a breeding frenzy within the species. The males will try to mate with as many females as possible, grabbing their newest mate by the neck and dragging them off to do the nasty. Average mating sessions last up to three hours, but can go on as long as a full day. That's because the males don't release very many sperm at a time, so they must ejaculate multiple times to ensure their genes are passed on. Like many human males trying to compensate for something, the quoll males are violent and ruthless. In fact, throughout all the biting, scratching and screeching, many females end up killed in the process, only to be eaten by their angry partner.

As if nature wished to compensate the females for their suffering, many of the males put out so much energy during the mating season that they lose weight, start balding and die within only a few weeks of their sexual rampage. 

 Bedbugs: Impaler? I Hardly Know Her

Bedbugs: Impaler? I Hardly Know Her
Why bother courting and mating when you can instead just impale and run? That seems to be the thought process behind the bedbug's reproduction method. Indeed, rather than finding the female's reproductive organs and getting a little frisky, this quick-moving bug just stabs his lady in her stomach, deposits his sperm and leaves. The sperm then travel through the female's blood stream into sperm receptacles and eventually into her waiting ovaries.

This type of mating behavior is known by the terrifying title of “traumatic insertion,” and it certainly lives up to its name. At least when it's happening to something as horrible as bed bugs it's a lot harder to feel bad for the victims. 

 Squid: Those Slippery, No-Good Cephalopods

Squid: Those Slippery, No-Good Cephalopods
Squids may not seem like the sexiest animals around, but as it turns out, they might be some of the kinkiest. The male bioluminescent Dana Octopus Squid uses its beak and sharp claws to pierce holes in its mate before using a penis-like appendage to insert sperm into the cuts. On the other hand, the Greater Hooked Squid just bypasses the stabbing step by using sperm that independently burrow their way into the female's skin, using an enzyme that dissolves tissue.

The Sharpear Enope Squid is the first-known transgender squid, as some males not only resemble females in appearance, but even have female sex glands. While the debate is still out on what evolutionary benefit this provides, some researchers speculate that it allows these individuals to get closer to potential mates without being detected. 

 Seals: Humping Their Way Onto The Endangered Species List

Seals: Humping Their Way Onto The Endangered Species List
Is there anything cuter than a baby seal? There is when it's been crushed to death by a horde of frisky male seals who wanted to get in the action when they heard another couple mating. Think that's a rare occurrence? Think again. Some colonies have been known to lose 2/3 of their cubs this way. That's why the babies grow up so darn fast –the sooner they bulk up, the sooner they can avoid being crushed to death. 

Of course, babies aren't the only ones at risk. The male Southern Elephant Seal often crushes the female's skull in his jaws during copulation and female Monk Seals are often mobbed to death by excited males when they go into heat. In fact, endangered seal species are some of the only at-risk creatures to be put on libido-suppressing drugs in order to stop them from sexing themselves into extinction.

Extreme cold weather hits Europe


Extreme cold weather hits Europe

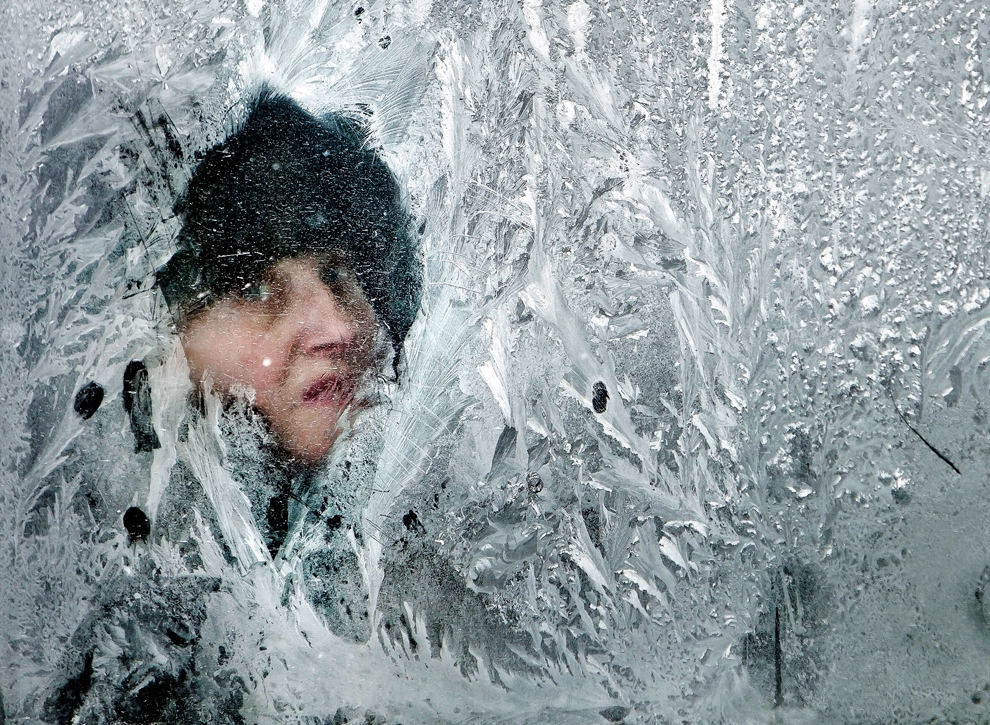
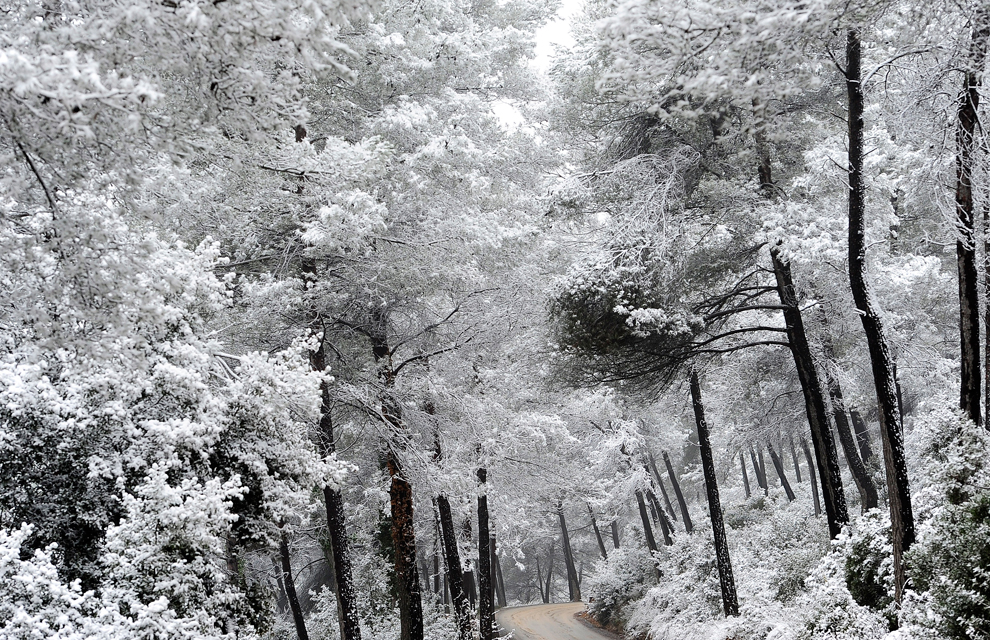
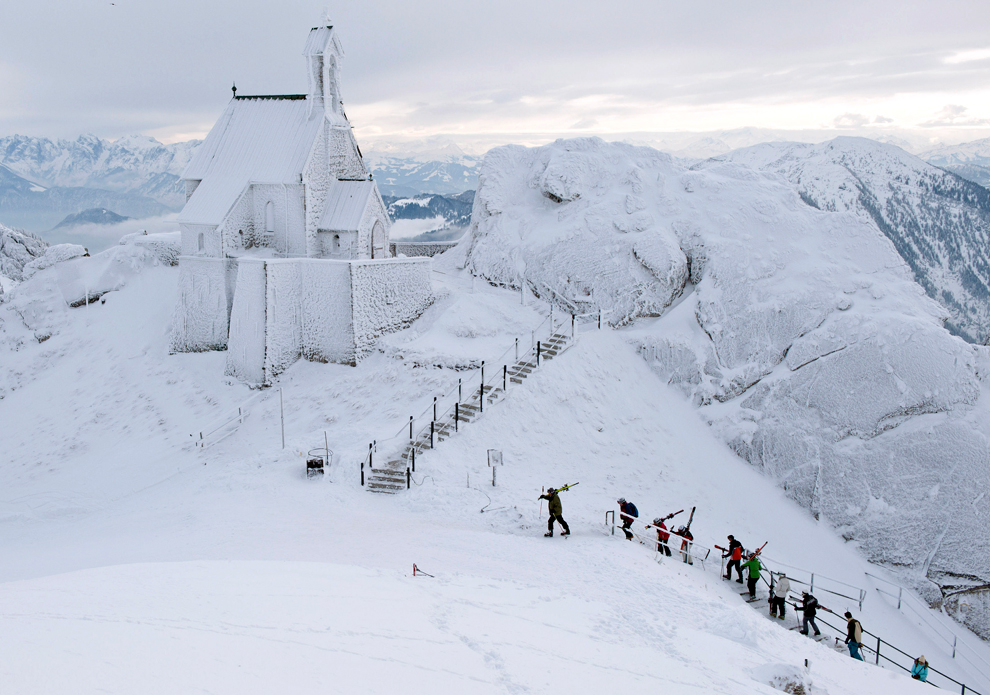
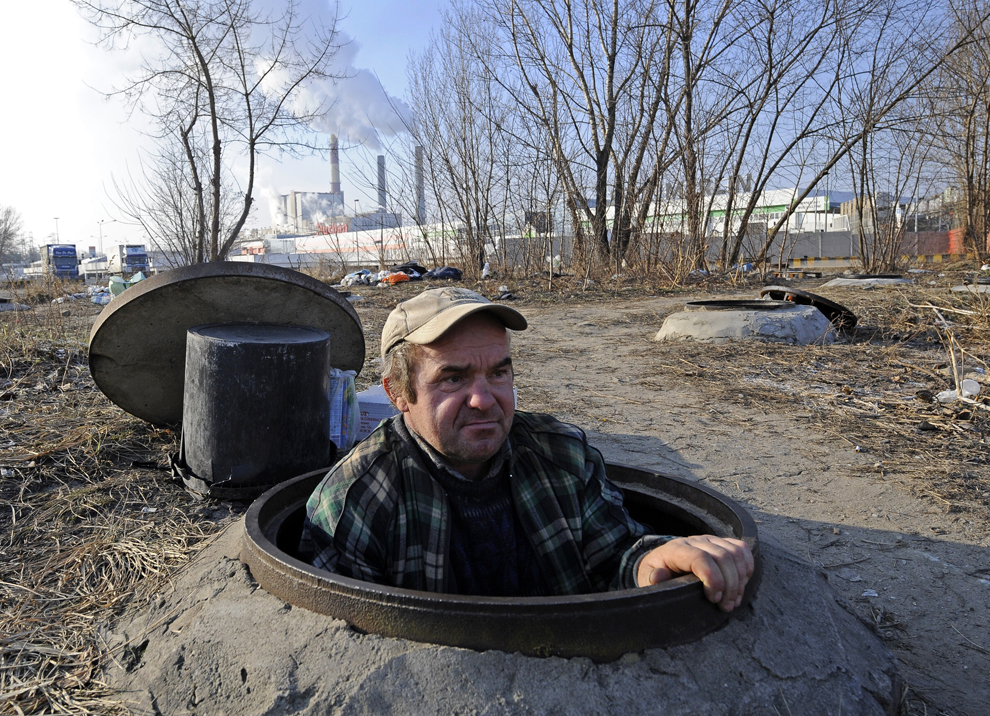
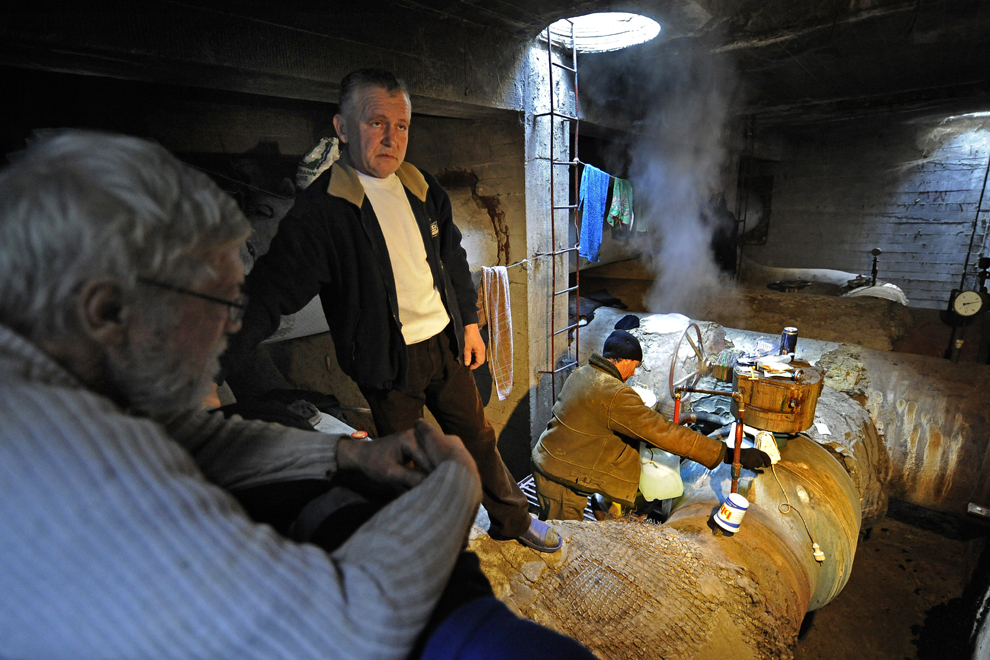
Frigid temperatures have gripped Europe in the last week, with the mercury reaching as low as 35 degrees Celsius below zero. After what had been a relatively mild winter, the sudden cold caught many unprepared. Eastern Europe is hardest hit, with over 100 deaths in Ukraine, and with over 11,000 people in remote villages cut off by snow in Serbia. Most of the fatalities recorded have been homeless people found frozen to death outside, and emergency tents with hot meals have been set up to help them in several affected countries. Russia and Poland are mobilizing help for the homeless. Travel in Romania has been chaos as a blizzard hampered efforts to clear both rails and roads. Recorded temperatures in Italy were the lowest in 27 years. -- Lane Turner (45 photos total)

A woman looks out a bus in Bucharest on February 2, 2012. (Vadim Ghirda/Associated Press)

2
Snow paints a scene in Rubi, Spain on February 2, 2012. (Manu Fernandez/Associated Press) #

3
Skiers approach Wendelstein church near Bayrischzell, Germany on January 31, 2012. (Lukas Barth/dapd/Associated Press) #

4
A homeless man emerges from Warsaw's underground heating duct where he lives on February 2, 2012. (Janek Skarzynski/AFP/Getty Images) #


The love of an 80 year old couple

A wonderful and peaceful film  about an old couple in India,


It’s a 10 minute film from India, An Excellent Short Film.Watch it all the way to the end to enjoy it.  
This film teaches us to valuewhat we have in life right now. 
Life could be so tough, but still it has green patches of True Love and Care.


WATCH OUT FOR TOXINS


GOING TO THE OFFICE? WATCH OUT FOR TOXINS

People who work long hours in the office end up with higher levels of some toxic chemicals in their blood.

THE GIST
  • Offices account for more than a third of a type of toxic chemical called PFCs in people’s blood.
  • Newer buildings and newly renovated offices contain higher levels of PFCs in the air than do older buildings.
  • The more time people spend in their offices, the more chemicals accumulate in their blood.

Many office workers are unknowingly exposed to significant levels of toxic chemicals which have been linked to reproductive, developmental, liver and immune problems in animals and people.
People who spend the most time at the office have the highest levels of polyfluorinated compounds (PFC) levels in their blood, found a new study, which also showed a direct link between chemical levels in the air of a person’s workplace and the amount of PFCs in his/her blood.
More than 95 percent of Americans harbor PFCs in their bodies, according to national health survey data. The new findings help narrow down major sources of exposure, opening up potential ways to reduce the burden of chemicals in our bodies.
“When we think of occupational exposures, it’s easy to think about construction workers or welders, but an even larger population is office workers,” said Michael McClean, an environmental health scientist at the Boston University School of Public Health. “We wanted to look at those environments and see what was in the air.”
PFCs are a group of chemicals that offer water-resistant and stain-resistant properties to a wide range of products, including carpets, furniture, food wrappings and nonstick pots and pans. Investigations have turned up significant levels of several PFCs in the environment and in people, but few studies have systematically considered where most of those chemicals come from.
McClean and colleagues decided to look at offices because people spend a lot of time at work, and because offices are full of stain-resistant furniture, paint, carpeting and other objects that can emit PFC-containing dust.
The team recruited 31 adults who live and work in Boston-area offices. About a quarter of their offices were in a new building that had been built the previous year and was decorated with brand new carpets, upholstered chairs and other furnishings. A quarter of workplaces were in older buildings with no recent history of renovation.
The remaining half of offices sat in a building that had been partially renovated the year before with new carpeting in the hallways and about 10 percent of rooms. All offices were painted from floor to ceiling, had closed-air ventilation, and at least one computer on a desk. And all had doors that were closed at night.
For a week during the winter, from 8 a.m. on a Monday to 8 a.m. on a Friday, air pumps collected particulate and gaseous matter from the air in each office. At the end of the week, researchers also collected blood and dietary information from every worker.
Levels of a chemical called FTOH were highest n the air of the new building and lowest in the air of the old one, the researchers reported in the journal Environmental Science & Technology. Our bodies break down FTOH into a PFC called PFOA.
When levels of FTOH were high in an office, people who worked in that office had higher levels of PFOA in their blood compared to people who worked in offices with lower levels. People who worked longer hours also inhaled more chemicals and accumulated higher levels of PFOA in their blood than did people who worked fewer days or shorter days.
Overall, the level of chemicals in the air of an office accounted for 36 percent of PFC levels in the blood.
“The fact that air in an office environment can explain more than a third of PFOA that you find in the blood,” McClean said, “is actually pretty striking.”
Scientists have long assumed that diet was the main source of PFCs in our bodies, said John Meeker, an environmental health scientist at the University of Michigan, Ann Arbor. Based the new findings, he said, it will now be useful to zero in on offices and figure out what it is about them that produces the most PFCs. The answers could lead to more regulations of products or safer renovation processes.
For now, it’s too soon to offer advice to office-workers about how best to reduce their exposures.
“We’re not going to tell people to stop going to the office,” Meeker said.


Top 10 Highly Developed Countries


Top 10 Highly Developed Countries

The Human Development Index (HDI) is a composite statistic used to rank countries according to their development levels from “very high” to “low.” Countries are placed based on life expectancy, education, standard of living, child welfare, health care, economic welfare, and population happiness. Formulas are used to factor all the variables and determine the scores of countries. Critics have cited the HDI as inaccurate or vague, but coming up with top ten highly developed countries list on my own opinion would have been very subjective and probably badly ranked. Thus, I have simply listed the first ten countries on the HDI and displayed their scores, while providing explanations. Enjoy.

10 Sweden
Score: 0.904

Sweden Stockholm
The socialist and largely liberal European country of Sweden (officially the Kingdom of Sweden) is led by Prime Minister Fredrick Reinfeldt and is about the size of the US state of California (or Spain if unfamiliar with the CA) and has an approximate population of 9.3 million with the capital and largest city being Stockholm. The Swedish people are rated as one of the happiest in the world and have high marks in income ($35,876 GDP per capita, and a regular GDP of $485 billion), life expectancy (80.9 years), and education. In addition, the country has very low unemployment and poverty rates, has equal and free access to health care, and has been one of the most active supporters of environmental sustainability today and pushes for other countries to “Go green.” Sweden also serves as a major tourist destination for millions of international travelers, as the country has a long and rich history.

9 Germany
Score: 0.905 Score

Germany
The Federal Republic of Germany, or Germany, has the largest economy in the European Union, and one of the largest populations at 82.2 million, as well as its bustling capital and economic center of Berlin. Chancellor Angela Merkel is the head of a government with a people of very high education standards, with a nearly 100% attendance rate and 99% literacy rate. Germany thrives in industry and manufacturing and is a major exporter of electrical and engineering products, such as cars (Volkswagen anyone?), and are renowned globally for their skilled work force. The GDP is $3.5 trillion and GDP per capita is $40,631, and poverty rates are low, although the unemployment rate is about 7%. Germany also, like Sweden, is a prime tourist destination for its historic beauty, and the wonderful people (aside from Adolf and the Nazis back in the 1930-40s) have a life expectancy of 79.4 years.

8 Liechtenstein
Score: 0.905

Photo Lg Liechtenstein
The Principality of Liechtenstein is one of the smallest and least populated countries in the world, with a landmass of just 160 square kilometers (62 sq miles, about the size of Washington, US) and a population of 35,000. Even so, this parliamentary democracy manages to have one of highest GDP per capita’s in the worlds ($141,000) and has virtually zero debt, poverty, and unemployment rates, while having prominent literary and education ratings. Liechtenstein has very low taxes imposed on its citizens and is a center of investment from countries and the wealthy. If ever feeling the desire to travel to this rather interesting country, visit the capital of Vaduz, where you can view the huge Vaduz castle, home to the prince and his family, while also getting acquainted with the city’s 5,100 inhabitants.

7 Ireland
Score: 0.908

Republic%20Of%20Ireland Country Image
The Republic of Ireland has a relatively small population of 4.5 million, is a parliamentary democracy, and its capital is Dublin. Ireland has a very high literacy rate of 99% and high education standards, as well as a strong life expectancy of 78.9 years. It also has a well balanced infrastructure, with a GDP of $203.89 billion and a GDP per capita rate of $45,497. The country is ranked #7 for its press freedom, economic freedom, and political freedom it offers to the public. Ireland was in the process of rapid economic growth and development when the global recession began in 2008. Ireland than experienced negative GDP and accumulated massive debt, being rated as one of the five European “P.I.I.G.S.” (Portugal, Ireland, Italy, Greece, and Spain) and losing two points on the Human Development Index Scale. Still, the Taoiseach (or Prime Minister) Enda Kenney is collaborating with EU leaders (France and Germany) to relieve this problem and continue developing forward.

6 Canada
Score: 0.908

Torxconto
Canada is, geographically, the second largest country next to Russia and shares the longest international border in the world with the United States. Canada is governed by a parliamentary democracy and a constitutional monarchy and keeps it ties with the United Kingdom close, being one of the few countries with two anthems (“O Canada,” the national anthem, and “God Save the Queen,” the Royal Anthem) with Queen Elizabeth II being the Head of State. The country is very economically advanced with a GDP $1.758 trillion and GDP per capita of $51,147. It has an intelligent population with high education and literacy rates, and a large percentage of the population is even bilingual or trilingual (English and French are the official languages, but Spanish doesn’t hurt). Canada is known for its free health care system (on top of an 80.7 life expectancy) and poses minimal taxes on the 34.7 million inhabitants. And of course, it is a great tourist destination, as you can visit the world-renowned waterfall of Niagara Falls, or the capital of Ottawa, or maybe even the historical landmarks at the largely French-rooted city of Quebec.

Most Venomous Animals- Blue Ring Octopus

Most Venomous Animals- Blue Ring Octopus


A serious threat in the coastal waters of Australia for those who wish to explore is the little blue ring octopus. They are currently recognized as one of the world’s most venomous marine animals. This small creature, about the size of a golf ball, or even smaller at times, is highly toxic to humans and there is no known antivenin for the venom of the Blue Ring Octopus, which is highly poisonous. The venom of the Blue Ring Octopus contains neuro toxins, and can lead to paralysis, and will, if left untreated, end up in cardiac arrest for the victim.


10 Amazing Facts About the Transit of Venus


10 Amazing Facts About the Transit of Venus

A transit in astronomical terms is when one heavenly body passes in front of another such that, as viewed from Earth, we can see one move across the other in the background. The moon transiting in front of the sun during a solar eclipse, for example. Much more rare than a solar eclipse is the planet Venus transiting the Sun. The last time this took place was in 2004. But you are in luck! The next transit of Venus will occur this year! On June 5 to June 6, 2012 those positioned in the right spot on Earth, and with clear skies, will get to see this very rare event. The best spot to see the transit will be in the Pacific Ocean. The island of Tahiti is ideal for those who wish to travel to see it happen and the island is making preparations for many “astronomy tourists” to go there to view the transit. Portions of the transit will be viewable from Europe and North America. Most of South America and western Africa will not be able to see the transit. What an observer will see is a small black dot (Venus) passing in front of the sun. Depending on where you are on Earth to view the transit, you may see the dot move slowly across the Sun for several hours.

Sequences of transits occur in a pattern that repeats every 243 years, with transits occurring eight years apart followed by a gap of 121.5 years, then a gap of eight years (the 2012 transit finishes the latest eight year period from the transit of 2004) and then another long gap of 105.5 years until the next transit. So for those who miss the Venus transit this June, you will have to live to be very old indeed to catch the next pair of transits (2117 and 2125). To see if you can view part or all of the 2012 Venus transit go here (warning – may need fast internet connection).


10 First Historical Observations

Bird Flies During Transit Of Venus
As Galileo invented his first telescope in 1609 the first chance to observe a Venus transit using modern optical devices came with the transits of 1631 and 1639. Five years before the 1631 transit, in 1627, Johannes Kepler became the first person to predict a transit of Venus. Kepler successfully predicted the 1631 event. However, Kepler was unable to determine where would be the best location to observe the transit, nor did he realize that in 1631 the transit would not be observable in most of Europe. Therefore, no one made arrangements to travel to where they could see it, and this transit was missed.
Fortunately, 8 years later on December 4, 1639, a young amateur astronomer by the name of Jeremiah Horrocks became the first person in modern history to predict, observe, and record a Venus transit. Horrocks corrected Kepler’s earlier calculations and realized what we now know about Venus transits, that they occur eight years apart after long (very long) waits. It is commonly stated that he performed his observations from Carr House in Much Hoole, near Preston England. Horrocks also told his friend, another amateur astronomer by the name of William Crabtree, about the coming predicted transit and he also spotted the planet’s silhouette on the solar disk. Crabtree probably observed near Broughton, Manchester England. Although Horrocks was uncertain when the transit would begin, he was lucky enough to guess the time so that he was able to observe part of it. He used a telescope to shine the image onto a white card, thus safely observing the transit without harming his eyes. Using his observational data, Horrocks came up with the best calculation for an Astronomical Unit (AU).

9 Used to Calculate an Astronomical Unit

Hubble
One hundred and twenty-two years later came the next eight-year pair of Venus transits. During that time the noted astronomer Edwin Hubble had proposed that scientists could gain an accurate estimate of the distance between the Earth and the Sun (an Astronomical Unit or AU) using the scientific principal of parallax. Parallax is the difference in the apparent position of an object viewed along two different lines of sight, and is measured by the angle or semi-angle of inclination between those two lines. Hubble correctly reasoned that if the Venus transit was viewed and measured from very distant points on the Earth, that the combined measurements, using parallax, could be used (with trigonometry) to calculate the actual distance between the Earth and the Sun (AU). Up to that time, the scientists were using Horrocks determination of AU, but realized they needed many more accurate observations to get a truer calculation.
Thus the Venus transits of 1761 and 1769 launched an unprecedented wave of scientific observations to the farthest points of the Globe. This was one of the earliest examples of international scientific collaboration. Getting (and surviving the trip) to these locations was as much an adventure as obtaining the first accurate data for a Venus transit. Scientists, mostly from England, France, and Austria, traveled to places as far apart as Newfoundland, South Africa, Norway, Siberia, and Madagascar. In South Africa very good measurements were obtained by Jeremiah Dixon and Charles Mason who would later go on to add their name to the historic Mason-Dixon Line in the USA. Noted points of the globe for the 1769 transit included Baja, Mexico; Saint Petersburg, Russia; Philadelphia Pennsylvania, USA; Hudson Bay, Canada; and from Tahiti, the great British explorer Captain Cook observed the transit from a place he called “Point Venus.”
Using the data obtained from the two transits, French astronomer Jérôme Lalande calculated the astronomical unit to have a value of 153 million kilometers. The calculation was a considerable improvement on Horrocks’ calculations from the 1639 observations. The modern measurement for an AU is 149 million kilometers (92,955,807.3 miles).

8 Discovery of the Atmosphere of Venus

Dn8066-1 600
Prior to astronomers viewing the transit of Venus no one knew Venus had an atmosphere. All of that changed with the 1761 Venus transit. Looking from the Petersburg Observatory, Russian scientist Mikhail Lomonosov predicted the existence of an atmosphere on Venus. Lomonosov saw the image of Venus refracting solar rays while he observed the transit. During the initial phase of the transit, he saw a ring of light around the trailing end of the planet (the portion that had not yet transited in front of the sun). He correctly inferred the only thing to explain the light refraction would be an atmosphere around the planet.

7 Black Drop Effect

Mo-Transit%20Teardrop%20Effect%20Closeup
When observing the Venus transit, the most critical times are the first, second, third, and fourth contact. Being able to clearly see and time these transitions – from the shadow of Venus not touching, to just first touching the suns disc (first contact) the time the shadow of Venus fully transits into the disc of the Sun (second contact), and then when exiting, the point where the leading edge of the shadow of Venus again touches off the disc of the Sun (third contact), back into outer space, and the time the entire shadow has left the disc of the Sun (fourth contact) and is no longer visible – is important to gain accurate data. Unfortunately, an optical phenomenon called the black drop effect makes it difficult to see the second and third contacts.
Just after second contact, and again just before third contact during the transit, a small black “teardrop” appears to connect Venus’ disk to the limb of the Sun, making it impossible to accurately time the exact moment of second or third contact. This negative impact on the timing of the second and third contact contributed to the error in calculation of the true value of AU, in 1761 and 1769 transits. It was first thought the black drop effect was caused by the thick atmosphere of Venus, but it is now believed it is caused mostly by interference in the Earth’s atmosphere. Today, better telescopes and optics are minimizing the black drop effect for astronomers observing Venus (and Mercury) transits.

6 Search for Extrasolar Planets

Home
By the time the 2004 and 2012 Venus transits rolled around, measurements of AU could be made using other and more accurate measuring techniques. However, that did not mean the 2004 and 2012 transits were not highly anticipated. They could still be used to do very important science, in this case, helping in the search for planets outside our solar system.
Scientists were eager to learn more about how patterns of light were dimmed and interfered with as Venus blocked out the Sun’s light. This would provide data to develop new and better methods to use the same technique to look for planets orbiting distant suns. Right now, a variety of other methods are used to “see” extrasolar planets orbiting distant suns. But most of these methods require the extrasolar planets to be very large – Jupiter-sized planets. Perfecting a way to “see” an extrasolar planet based on the light it blocks, coming from its sun, when it transits, would be a much more accurate way to detect the planet and could be used to ‘see” and calculate the size of much smaller planets orbiting these suns. However, extremely precise measurement is needed: for example, the transit of Venus causes the Sun’s light to drop by a mere 0.001 magnitude, and the dimming produced by small extrasolar planets will be much less.


123